
Visual Graphing to See Relationships
27th May 2013
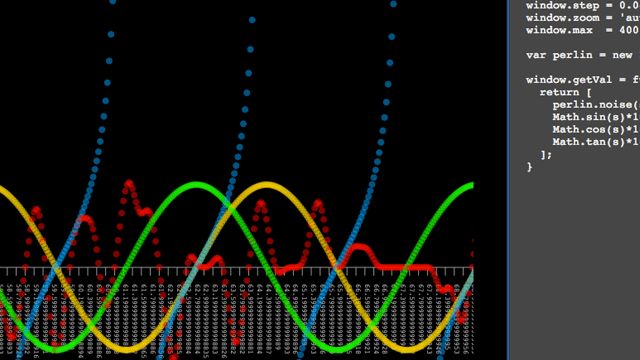
I have been working with Canvas 2D and WebGL recently and have been using Maths I never expected to see again once I left school. One thing that has been really useful when turning mathematical functions in to something visual is to see a graph representation of the values.
I have created a [simple graphing playground](/teststation/creative-
js/grapher/2d.html) to test out these functions and compare them to
each other. You can see below the difference between the sin, cos
and tan functions alongside the ImprovedNoise generator built in
to Three.js.
{% include iframeWithLink.html src="https://davetayls.me/teststation/creative-js/grapher/2d.html" caption="Comparing sin, cos, tan and ImprovedNoise" %}
Go ahead and play with the code to the right. Hit Ctrl+Enter to update.
Noise
I have been reading about Perlin Noise and how it is used for generating random landscapes and clouds. It's coming in very handy with a very visual project I am working on at the moment. What's really important with this slightly predictable noise generation is that you can seed it with a number (or more) and it will always return the same result given the same input.